In the separate analysis window of the spectral scan, there are different ways to show the frequencies and frequency ranges along with any potential interference. The following buttons are available at the top of the window:
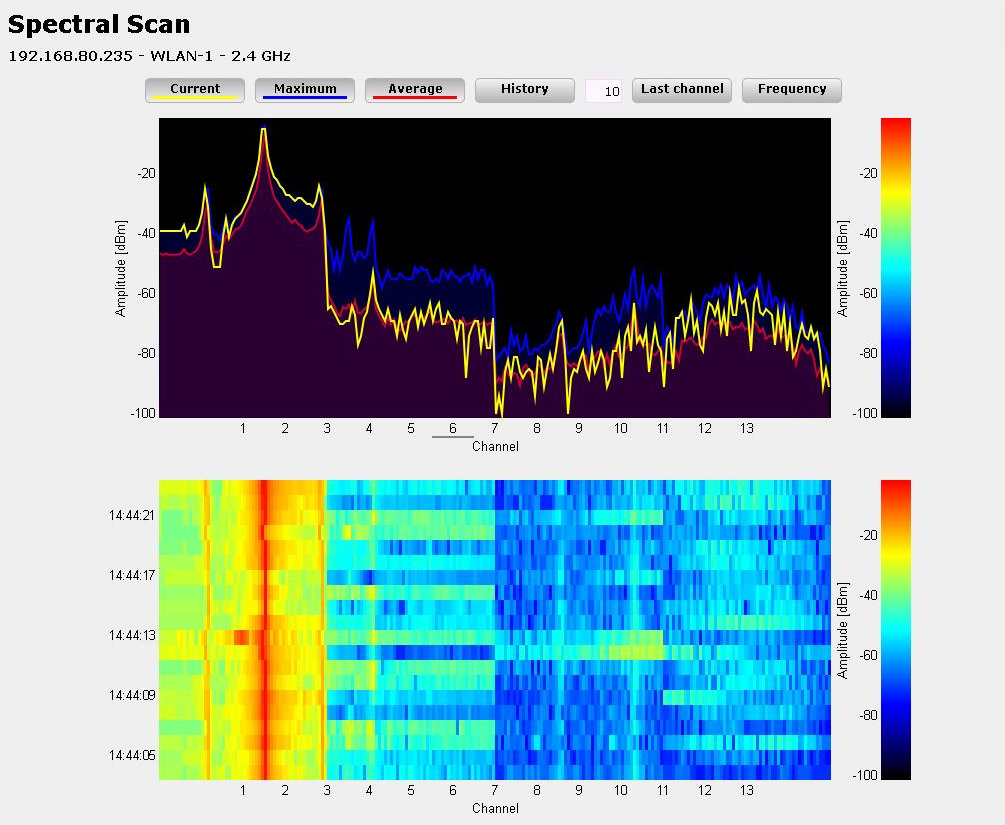
- Current: Shows or hides the curve of the values being measured.
- Maximum: Shows or hides the maximum values of the ongoing spectrum scan in relation to the currently set history range.
- Average: Shows or hides the average values of the ongoing spectral scan in relation to the currently set history range.
- History: Shows or hides the values last measured.
- Number of history values: Determines the number of the most recent results to be displayed. You are able to show at least the last 5 and at most the last 50 measuring points for every frequency.
- Last channel: Shows or hides the channel last used.
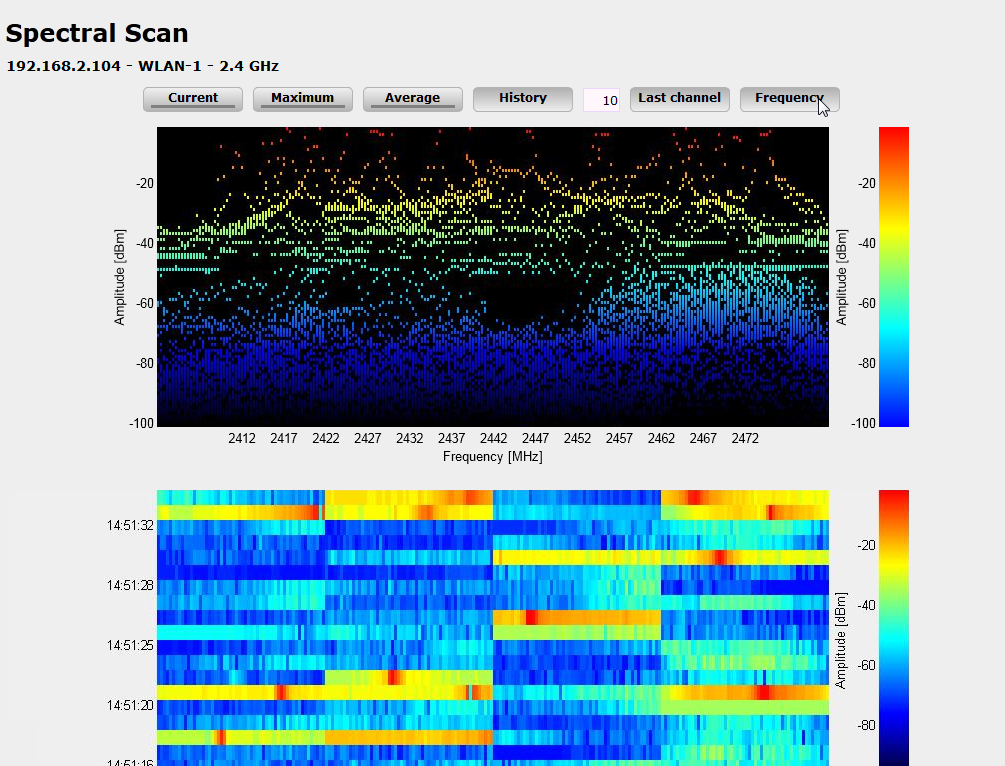
- Frequency: Switches the display on the X-axis between WLAN channel and frequency.
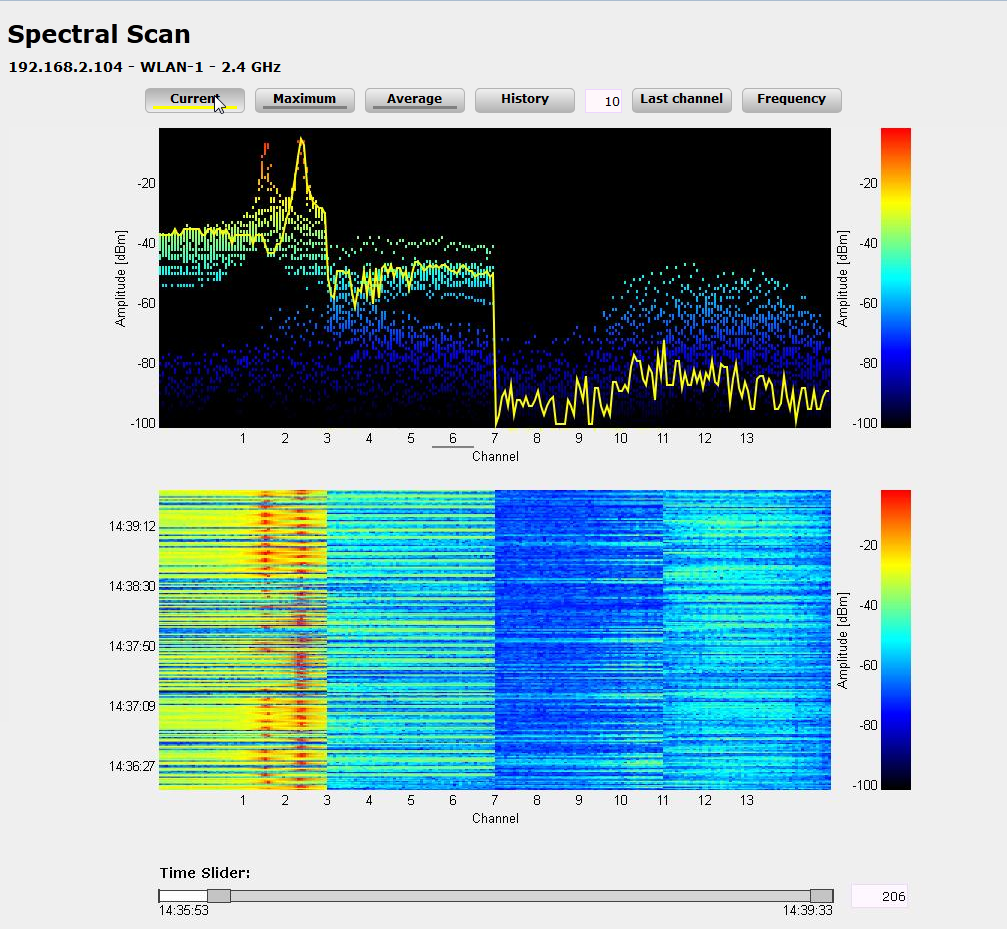
The window contains two graphical views showing the readings in a different manner. The top diagram shows the signal strength in dBm on the Y-axis, and either the WLAN channel or the relevant frequency on the X-axis. The lower diagram contains the analysis progression over time in the form of a waterfall diagram, with the Y-axis showing the time and the X-axis again showing the WLAN channel or the relevant frequency. These view formats depict both continuous and occasional interference on the frequencies, so helping you to take appropriate action to improve the connection (e.g. by changing the channel or identifying and eliminating the interference source). For example, certain interference sources such as microwave devices, DECT telephones (working in the 2.4 GHz frequency range) and audio-video transmitters exhibit very typical transmit patterns that occur prominently in both diagrams.
On the lower border of the window there is a slider labeled Time slider. This enables you to extend or limit the time period analyzed for the waterfall diagram. Alternatively, you can use the input box to the right of the slider to select how many readings you would like to display in the waterfall diagram. The web application can display up to 300 readings in the waterfall diagram using the time slider. The readings from a maximum of 24 hours can be cached.
Below are some examples of analysis results, which graphically represent other settings in different ways: