The monitoring functions of the LANCOM Management Cloud
"Trust is good, control is better". This motto could have been written for network administrators: Even a single error at a critical point can have disastrous consequences for the functionality and security of the company's IT. But in the age of software-defined networks with highly automated management functions from a central cloud – is this saying now obsolete?
On the one hand, yes it is: The high degree of automation now dramatically minimizes the human “uncertainty factor”. Configuring dozens of switches or firewalls manually on the hardware of course provokes a far higher error rate than having the components automatically and reliably retrieve the specified network configuration from a cloud-based controller. On the other hand, no it isn’t: The devil is in the detail, no one can guarantee 100 percent freedom from errors and, at the end of the day, common sense beats artificial intelligence.
But: Cloud-controlled network management can help with checks – thanks to a well thought-out information policy.
Is your company NIS2-compliant and digitally sovereign?
Take control of your network security and Digital Sovereignty. Security requirements are increasing: starting in 2024, the EU NIS2 directive will apply to more companies than ever before and mandate stricter measures for network and information security. Additionally, Digital Sovereignty is becoming an increasingly urgent issue in Europe. It’s worth checking whether your company needs to take action. We provide informational material and practical tips to help:
Learn more about NIS2 and Digital Sovereignty
The basic philosophy of the LANCOM Management Cloud is the proactive principle. So instead of “find the bug” we have a crystal-clear notification policy, where any potential hazards such as devices that need updating and other “anomalies” that the system detects are reported in plain text to the human operator. Furthermore, the LANCOM Management Cloud allows the user to design a control cockpit any way they like.
A selection of widgets allow individual dashboards to be constructed from a wide variety of monitoring and display modules, which are easily clicked together and saved as a collection.
Monitoring dashboards
In the following we present three examples of dashboard views for monitoring Wi-Fi, VPN, and network security.
Dashboard VPN and WAN
All mapped out
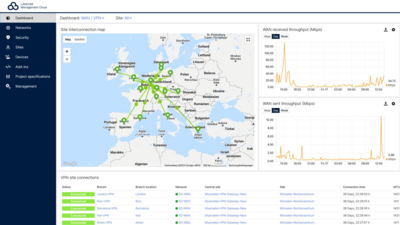
All mapped out: The map view on the left illustrates all of the VPN tunnels between a company's sites. The green lines shown here indicate that all is functioning properly. If the system detects an anomaly, the connection changes to red and the responsible IT staff member can take action, for example to reconnect an interrupted VPN connection.
The diagrams to the right show the number of connections over a given time period and the data throughput that the routers send and receive. Also, the site connections appear in a list view with the most important connection quality data.
Eye for detail
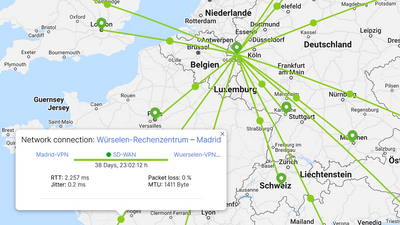
Further detailed information on the connection quality can be seen by clicking on the relevant VPN tunnel:
A pop-up shows how long the connection has been running trouble-free and provides the main quality parameters such as the round trip time of the data packets (RTT), packet losses, jitter, and the maximum transmission unit of the data packets in bytes (MTU).
Modern network management
„Globalization, digitalization and the pandemic have shown companies that the technical prerequisites for a future-proof operation are not yet fully developed. Not only the number, but also the variation of the devices in the network has risen rapidly alone by the fact that a lot of employees have switched to working from home. [...] Today, a network architecture uses a large number of sensors, controllers, routers, switches and access points. In addition, the networking of different locations has become a significant factor in the efficient operation of the entire company due to globalization, internationalization and outsourcing as well as the integration of business areas. What is needed are network management solutions that intelligently organize, optimize and manage these components and enable the network to achieve a holistic security standard.“ – techconsult study from 2022
Dashboard Wi-Fi and LAN
Site inspection by mouse click
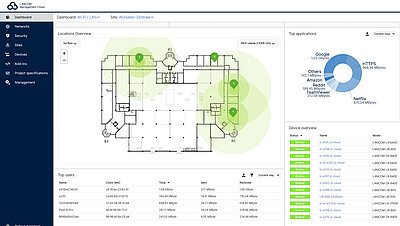
After you upload your building’s floorplans, you can place your access points on them and immediately see an overview of what is happening on every floor, in every room, at every site.
The circles around each access point indicate the coverage it offers (theoretical value without the influence of the walls) and thus provide reference points for planning and troubleshooting.
Health check for Wi-Fi
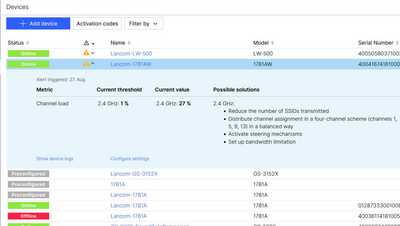
Sheer genius: In addition to overall views such as the pie chart of the most frequently used applications, statistics on the number of users, or load – all in retrospect for up to seven days if desired – IT managers can obtain a precise insight into the "state of health" of their Wi-Fi at the click of a mouse.
For example, if a warning appears about an overload, the causes can be easily identified with the individual device view, so the error can be corrected quickly and accurately.
Optimal channel distribution, bandwidth, and transmission power
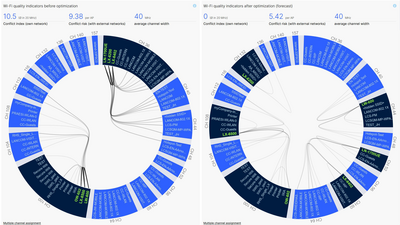
Soon the LANCOM Management Cloud will even be able to take third-party WLAN networks into account thanks to the automated, self-learning Wi-Fi optimization solution LANCOM Active Radio Control 2.0. A clear pie chart shows the current channel assignment and distribution of the company's own and third-party access points and indicates unfavorable multiple occupancies (left diagram).
On the basis of real usage data, LANCOM Active Radio Control 2.0 scans the Wi-Fi for potential improvements and clearly predicts the expected status after optimization in another diagram (here on the right). If the administrator wishes to adopt the suggested configurations, it takes just one click to roll out the currently best possible WLAN settings.
More about holistic Wi-Fi optimization with LANCOM Active Radio Control 2.0
Imminent danger
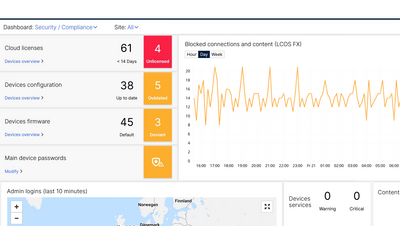
The security dashboard flags up hazards at a glance: Devices with unsecure passwords, outdated firmware, or which permit unsecure services or ports on the network. Color coding based on the traffic-light principle indicates the urgency of a potential security risk.
The diagram below provides information about the security level of the network. The curve shows blocked connections through the firewalls at the sites over a period of one hour, one day, or one week.
SIEM integration service for cloud-managed LANCOM R&S®Unified Firewalls
Robust security management is essential, especially for larger organizations and managed service providers (MSPs). A centralized Security Information and Event Management (SIEM) system helps organizations detect, analyze, and respond to security threats quickly.
We invite you to enhance your SIEM with our integration service for cloud-managed LANCOM R&S®Unified Firewalls, ensuring comprehensive detection of attacks on your network infrastructure. Further information about technical prerequisites and setup can be found here:
Even deeper insights
You see: Network management with the LANCOM Management Cloud is not only as pleasant and relaxed as lying on clouds, but also as clearly arranged as if you were sitting on a cloud and had everything in view from up there.
The nice thing is: If you want, you don't have to come down from up there either. Just take a look at our info papers, tech papers and white papers, browse through our tutorials and the LMC FAQ, or float through the LMC user interface in live view. We look forward to seeing you!
Infopaper: LMC User Roles and Rights
Infopaper: LMC (Public) Data Protection and Data Security
Infopaper: LMC – SIEM Integration Service
Techpaper: Concepts of the LANCOM Management Cloud (LMC)
Techpaper: LANCOM Management Cloud - Rollout
Techpaper: Cloud-managed Hotspot
Techpaper: Scheduled Events in the LMC
Whitepaper: LANCOM Cloud-managed hospital networks (SDN)
Whitepaper: Cloud Management and Software-defined Networking


